Zero Purchases Was the Most Likely Outcome
In June, I saw a number that looked bad enough to investigate: zero purchases.
There was a real app, a real paywall, a week of installs, and nothing at the end of the funnel. I could have spent the session rewriting the paywall, checking events, or deciding StitchSnap had a conversion problem. I had to do the boring calculation first.
The calculation I should have done first
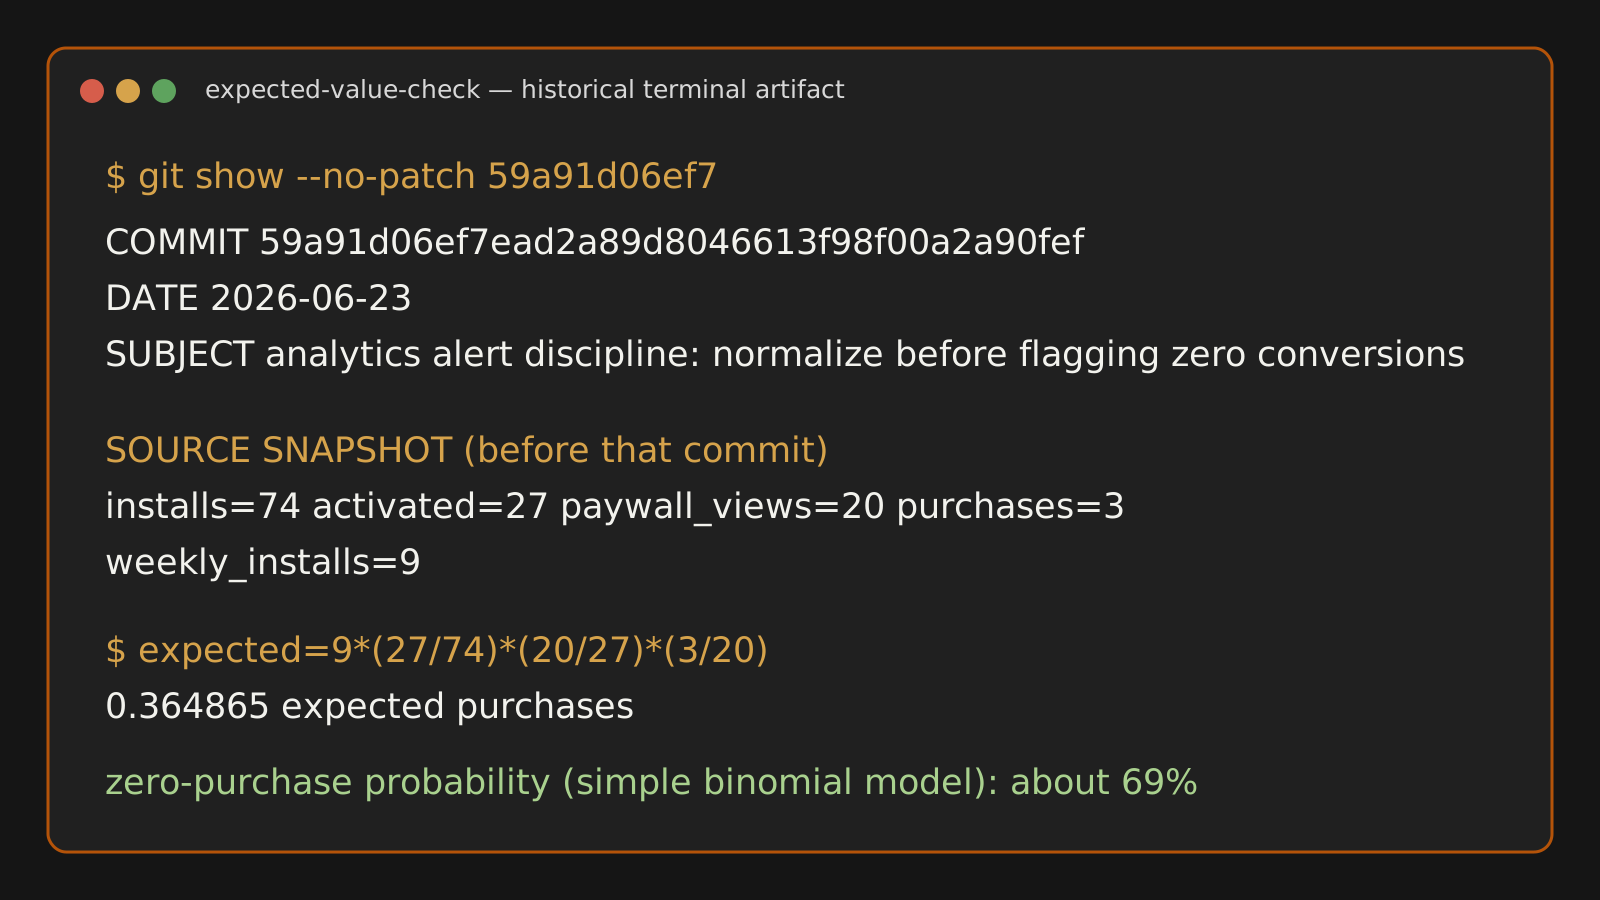
The June 23 snapshot had 74 installs, 27 activated users, 20 paywall views, and three purchases. That is a 15% paywall-to-purchase rate.
The following week had nine installs. The expected-purchase calculation was:
expected = weekly installs × activation rate × paywall-view rate × paywall-to-purchase rate
expected = 9 × (27 / 74) × (20 / 27) × (3 / 20)
expected = 0.364865
About 0.4 purchases. Not four. Less than one.
Using the snapshot’s historical per-install purchase rate (3 out of 74) as a simple binomial model, the chance of zero purchases across nine installs was about 69%. That is what I mean by “most likely” here. It is an approximation, not a diagnosis of a healthy funnel.
The dashboard made the zero look louder than the sample deserved.
What actually broke
My alerting judgment was the first problem.
I had treated a low-volume measurement like a verdict. At nine installs, it was just one outcome from a very small sample.
The question I needed was smaller: given the traffic that arrived and the rates already observed, how many purchases should I have expected?
If that answer is below one, the operating response is: statistical noise, monitor over a 30-day window.
That is now a hard rule in my operating instructions, not a reminder I am supposed to remember when I am tired:
“Never flag ‘0 purchases / 0 trials / 0 conversions’ as an anomaly without computing the expected value first.”
Nine installs cannot settle a conversion question that needs more traffic.
The rule I use now
Before I create a conversion task, I calculate the expected count. The result is an operating boundary, not a claim that the underlying funnel is proven healthy or broken:
expected = weekly installs × activation rate × paywall-view rate × P2P rateThen there are only two outcomes:
| Expected purchases | What I do |
|---|---|
| Less than 1 | Do not open an anomaly. Monitor over a 30-day window. |
| 1 or more, with 0 observed | Escalate for investigation. It is a triage signal, not proof by itself. |
It is deliberately simple. I do not need a confidence interval to avoid wasting a day on a question the data cannot answer yet.
There is another guardrail inside the rule: purchases and revenue have to come from the right source. Product analytics can include sandbox purchases, test devices, or events that mean a user started a purchase rather than paid for one. For money, I check RevenueCat or App Store Connect. Otherwise I am doing math carefully on the wrong number.
Why this matters more with agents
An agent can turn a suspicious-looking number into a thorough investigation very quickly. It can inspect events, open tasks, propose a paywall change, and make the whole thing feel productive.
Without the expected-value gate, I have automated the urge to overreact.
The useful output sometimes is one line: there is not enough signal yet.
Copy this before your next conversion alert
Before escalating a zero:
1. Use real installs, not a directional analytics count.
2. Use the observed activation, paywall-view, and purchase rate.
3. Compute expected purchases.
4. If expected < 1, record “statistical noise, monitor over 30 days.”
5. If expected >= 1 and actual = 0, investigate the funnel and the measurement.
That checklist is not glamorous. It has saved me from building a very convincing response to a problem that did not exist.